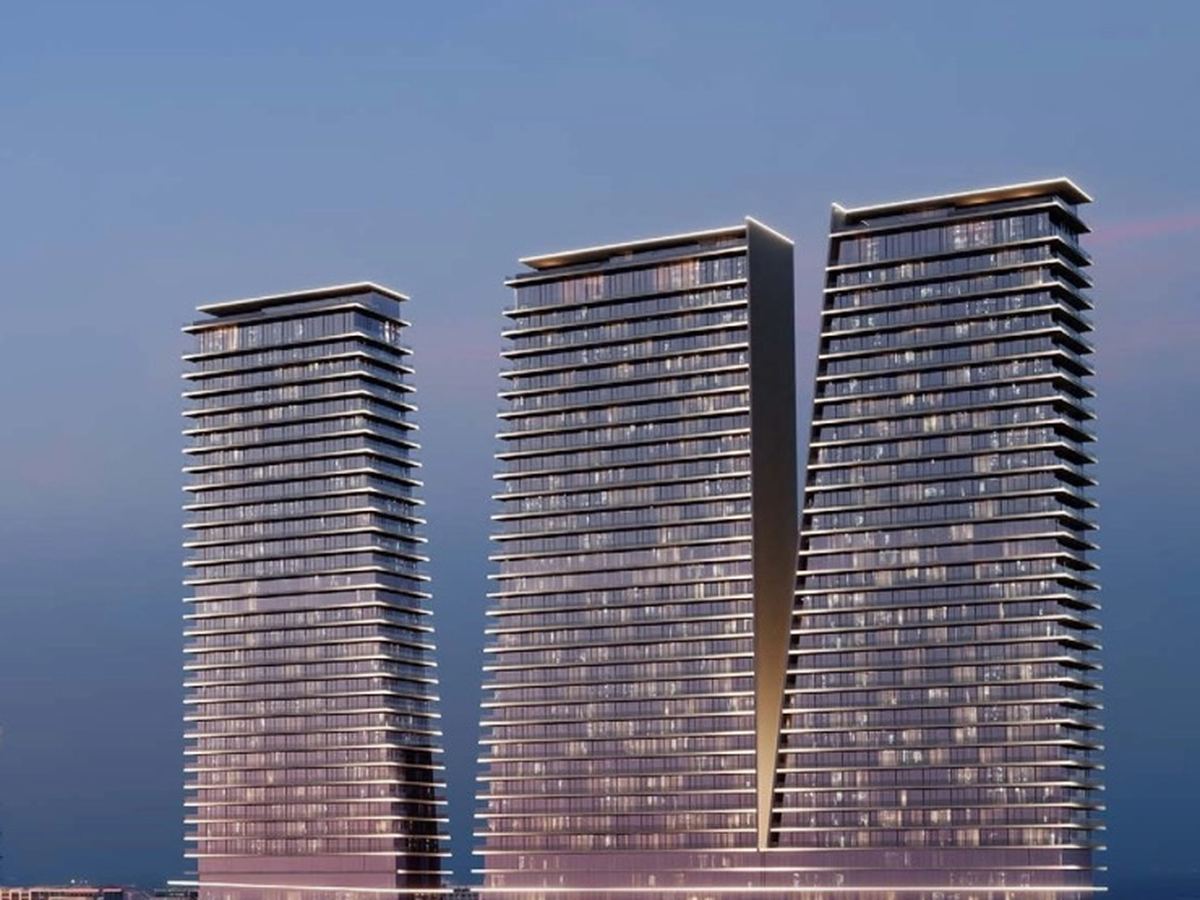



AED 3,700,000Furnished
Burj Khalifa & Downtown Views | Semi-Furnished
Paramount Tower Hotel & Residences, Business Bay
- 3 beds
- 4 baths
- 1,586 sq ft

In October 2026, the median apartment price in Business Bay was AED 2,018 per sq ft, across 344 residential sales transactions worth AED 835 million, according to Richmond Properties' analysis of Dubai Land Department data.
October 2026, compared with September 2026
Lighter bars: fewer than 30 leases
Off-planReadyTotal sales
NewRenewedTotal lease registrations
Paramount Tower Hotel & Residences, Business Bay

Aykon City Tower C, Business Bay, Dubai, UAE, Business Bay
An advisor can compare these figures with your budget, target yield and timeline, and explain how buying from overseas works, in a call at a time that suits your time zone.
Residential sales transactions in Business Bay totalled 344 in October 2026, worth AED 835 million. Sales rose 4.9% month-on-month. Off-plan sales accounted for 28% of the total and owner resales 51%.
The median apartment price in Business Bay was AED 2,018 per sq ft in October 2026, across 344 sales; it remained stable month-on-month, and was 22% above the Dubai median.
The monthly median apartment price in Business Bay declined 25.5% between January 2026 and October 2026.
In Business Bay in October 2026, median prices were AED 1.8 million for a 1-bedroom apartment (183 sales); AED 2.4 million for a 2-bedroom apartment (70 sales).
| Bedrooms | Sales | Median price | Per sq ft |
|---|---|---|---|
| Studio | 57 | AED 1.0 million | AED 2,322 |
| 1-bed | 183 | AED 1.8 million | AED 2,013 |
| 2-bed | 70 | AED 2.4 million | AED 1,843 |
| ⚠3-bed | 28 | AED 4.7 million | AED 1,752 |
| ⚠4-bed | 6 | AED 8.7 million | AED 3,197 |
The median rental rate on new apartment lease registrations (Ejari) in Business Bay was AED 118 per sq ft a year in October 2026, across 2,124 registrations. 2,126 new leases and 1,085 renewals were registered with Ejari.
The gross rental yield on ready apartments in Business Bay was 6.4% in October 2026, comparing median new rents with median ready sale prices per sq ft.
The UAE dirham is pegged to the US dollar at AED 3.6725. At that rate, in Business Bay in October 2026, the median apartment price of AED 2,018 per sq ft is approximately $549 per sq ft; the median new apartment rental rate of AED 118 per sq ft a year is approximately $32.
9 prime sales (AED 10 million and above) were recorded in Business Bay in October 2026, worth AED 164 million and accounting for 2.6% of sales. Villas and townhouses accounted for 0 of them and off-plan sales for 6. They included 1 super-prime sales ($10 million and above, approximately AED 37 million), worth AED 46.2 million.
The median apartment price in Business Bay was 22% above the Dubai median in October 2026, at AED 2,018 per sq ft compared with AED 1,661.
| Measure | Business Bay | Dubai |
|---|---|---|
| Apartments, median per sq ft | AED 2,018 | AED 1,661 |
| New apartment rent, per sq ft a year | AED 118 | AED 95 |
| Gross yield, apartments | 6.4% | 6.9% |
| Off-plan share of sales | 28% | 59% |
Regalia by Deyaar recorded the most sales of any building in Business Bay in October 2026, with 30 sales worth AED 45.8 million.
| Building or sub-community | Developer | Sales | Value | Off-plan | Apartments, per sq ft |
|---|---|---|---|---|---|
| RegaliaBusiness Bay | Deyaar | 30 | AED 45.8 million | 0% | AED 1,770 |
| ⚠Sls DubaiBusiness Bay | WOW RED | 26 | AED 53.3 million | 0% | AED 1,708 |
| ⚠The EDGEBusiness Bay | Select Global | 26 | AED 39.5 million | 0% | AED 2,327 |
| ⚠Binghatti AquariseBusiness Bay | Binghatti | 24 | AED 53.2 million | 100% | AED 2,431 |
| ⚠Peninsula FourBusiness Bay | Select Global | 22 | AED 57.4 million | 0% | AED 2,467 |
| ⚠Damac Towers By ParamountBusiness Bay | DAMAC | 12 | AED 23.1 million | 0% | AED 1,374 |
| ⚠One by BinghattiBusiness Bay | Binghatti | 9 | AED 22.2 million | 100% | AED 2,161 |
| ⚠Bayz 102 By DanubeBusiness Bay | Danube | 8 | AED 30.2 million | 100% | AED 3,339 |
| ⚠Peninsula TwoBusiness Bay | Select Global | 7 | AED 10.9 million | 0% | AED 2,504 |
| ⚠Binghatti SkyriseBusiness Bay | Binghatti | 7 | AED 9.8 million | 100% | AED 2,491 |
Binghatti recorded the most off-plan sales in Business Bay in October 2026, with 46 sales worth AED 144 million, accounting for 47% of off-plan sales. It was followed by Danube (11), DAMAC (8).
| Developer | Off-plan sales | Value | Share of off-plan sales |
|---|---|---|---|
| Binghatti | 46 | AED 144 million | 47% |
| Danube | 11 | AED 39.7 million | 11% |
| DAMAC | 8 | AED 15.4 million | 8% |
| Alseeb | 5 | AED 23.9 million | 5% |
| Ellington | 4 | AED 17.1 million | 4% |
| Emaar | 3 | AED 32.5 million | 3% |
| Deyaar | 3 | AED 11.0 million | 3% |
| Al Habtoor | 3 | AED 7.5 million | 3% |
Richmond Properties (2026). Business Bay Market Report: October 2026. Data: Dubai Land Department. Published 4 November 2026. https://richmondproperties.ae/insights/market-reports/business-bay/2026-10. Licensed CC BY 4.0.
In copy: “according to Richmond Properties’ analysis of Dubai Land Department data”.
Figures are Dubai Land Department open data for October 2026, compared with September 2026. Sales are counted by transaction date and cover homes only: apartments, hotel apartments, villas and townhouses (including villa plots). Offices, shops, hotel rooms, development land and labour accommodation are excluded. Rents are new Ejari leases; leases are assigned to a community through their building or sub-community where DLD files them under a different district. 2 transactions identified as recording errors are excluded. Figures and text are generated from Dubai Land Department data by Richmond Properties’ reporting system. Data as of 4 November 2026. This report is for general information and is not financial or investment advice.